What is a Pipeline Profiler?
Firstly, let's answer what a pipeline is. A pipeline in Sitecore is essentially an ordered sequence of processes (called processors) that run to perform a specific task in the system. Sitecore’s pipeline profiler is a built-in diagnostic tool that tracks how long each pipeline and processor takes to execute.
Why is this useful? In complex Sitecore solutions, it can be difficult to know what exactly is happening inside the pipelines at runtime, especially after deploying to a cloud or container environment. Pipeline profiling helps answering questions like: "Is my custom pipeline processor actually running, and in the correct order?" or "Which part of the request pipeline is slowing down page loads?". In other words, it provides visibility into the inner workings and performance of Sitecore’s processing framework.
By default, pipeline profiling is disabled for performance reasons, but when enabled, it records metrics like execution counts and timings for each pipeline processor. This data is exposed via an admin page so you can see which pipelines or steps are consuming the most time.
Why and When to Enable Pipeline Profiling
You should consider enabling pipeline profiling only when you need to diagnose or debug pipeline behavior, especially for diagnosing bottlenecks and verifying pipeline behavior in real scenarios. It’s not something to leave on all the time (more on that in considerations below), but it’s invaluable as a temporary diagnostic tool during development, testing, or troubleshooting.
How to Enable Pipeline Profiling
You just toggle it via a config patch or environment setting.
<add key="env:define" value="Profiling" />
This above env:define setting named "Profiling" acts as a flag that enables the pipeline profiling configuration. Use the full configuration patch file, as below to enable the profiler:
<?xml version="1.0"?>
<configuration xmlns:patch="http://www.sitecore.net/xmlconfig/">
  <sitecore>
    <settings>
      <!-- Enable pipeline profiling -->
      <setting name="Pipelines.Profiling.Enabled">
        <patch:attribute name="value">true</patch:attribute>
      </setting>
      <!-- (Optional) Enable CPU time measurements for profiling -->
      <setting name="Pipelines.Profiling.MeasureCpuTime">
        <patch:attribute name="value">false</patch:attribute>
      </setting>
    </settings>
  </sitecore>
</configuration>
How to access the Pipeline Profiler page
After enabling profiling and restarting, log in to Sitecore and navigate to the special admin page on your CM instance URL: /sitecore/admin/pipelines.aspx. You must be logged in as an administrator to access it, like you do for other admin pages.
You should see a table of all pipelines that have executed since startup:
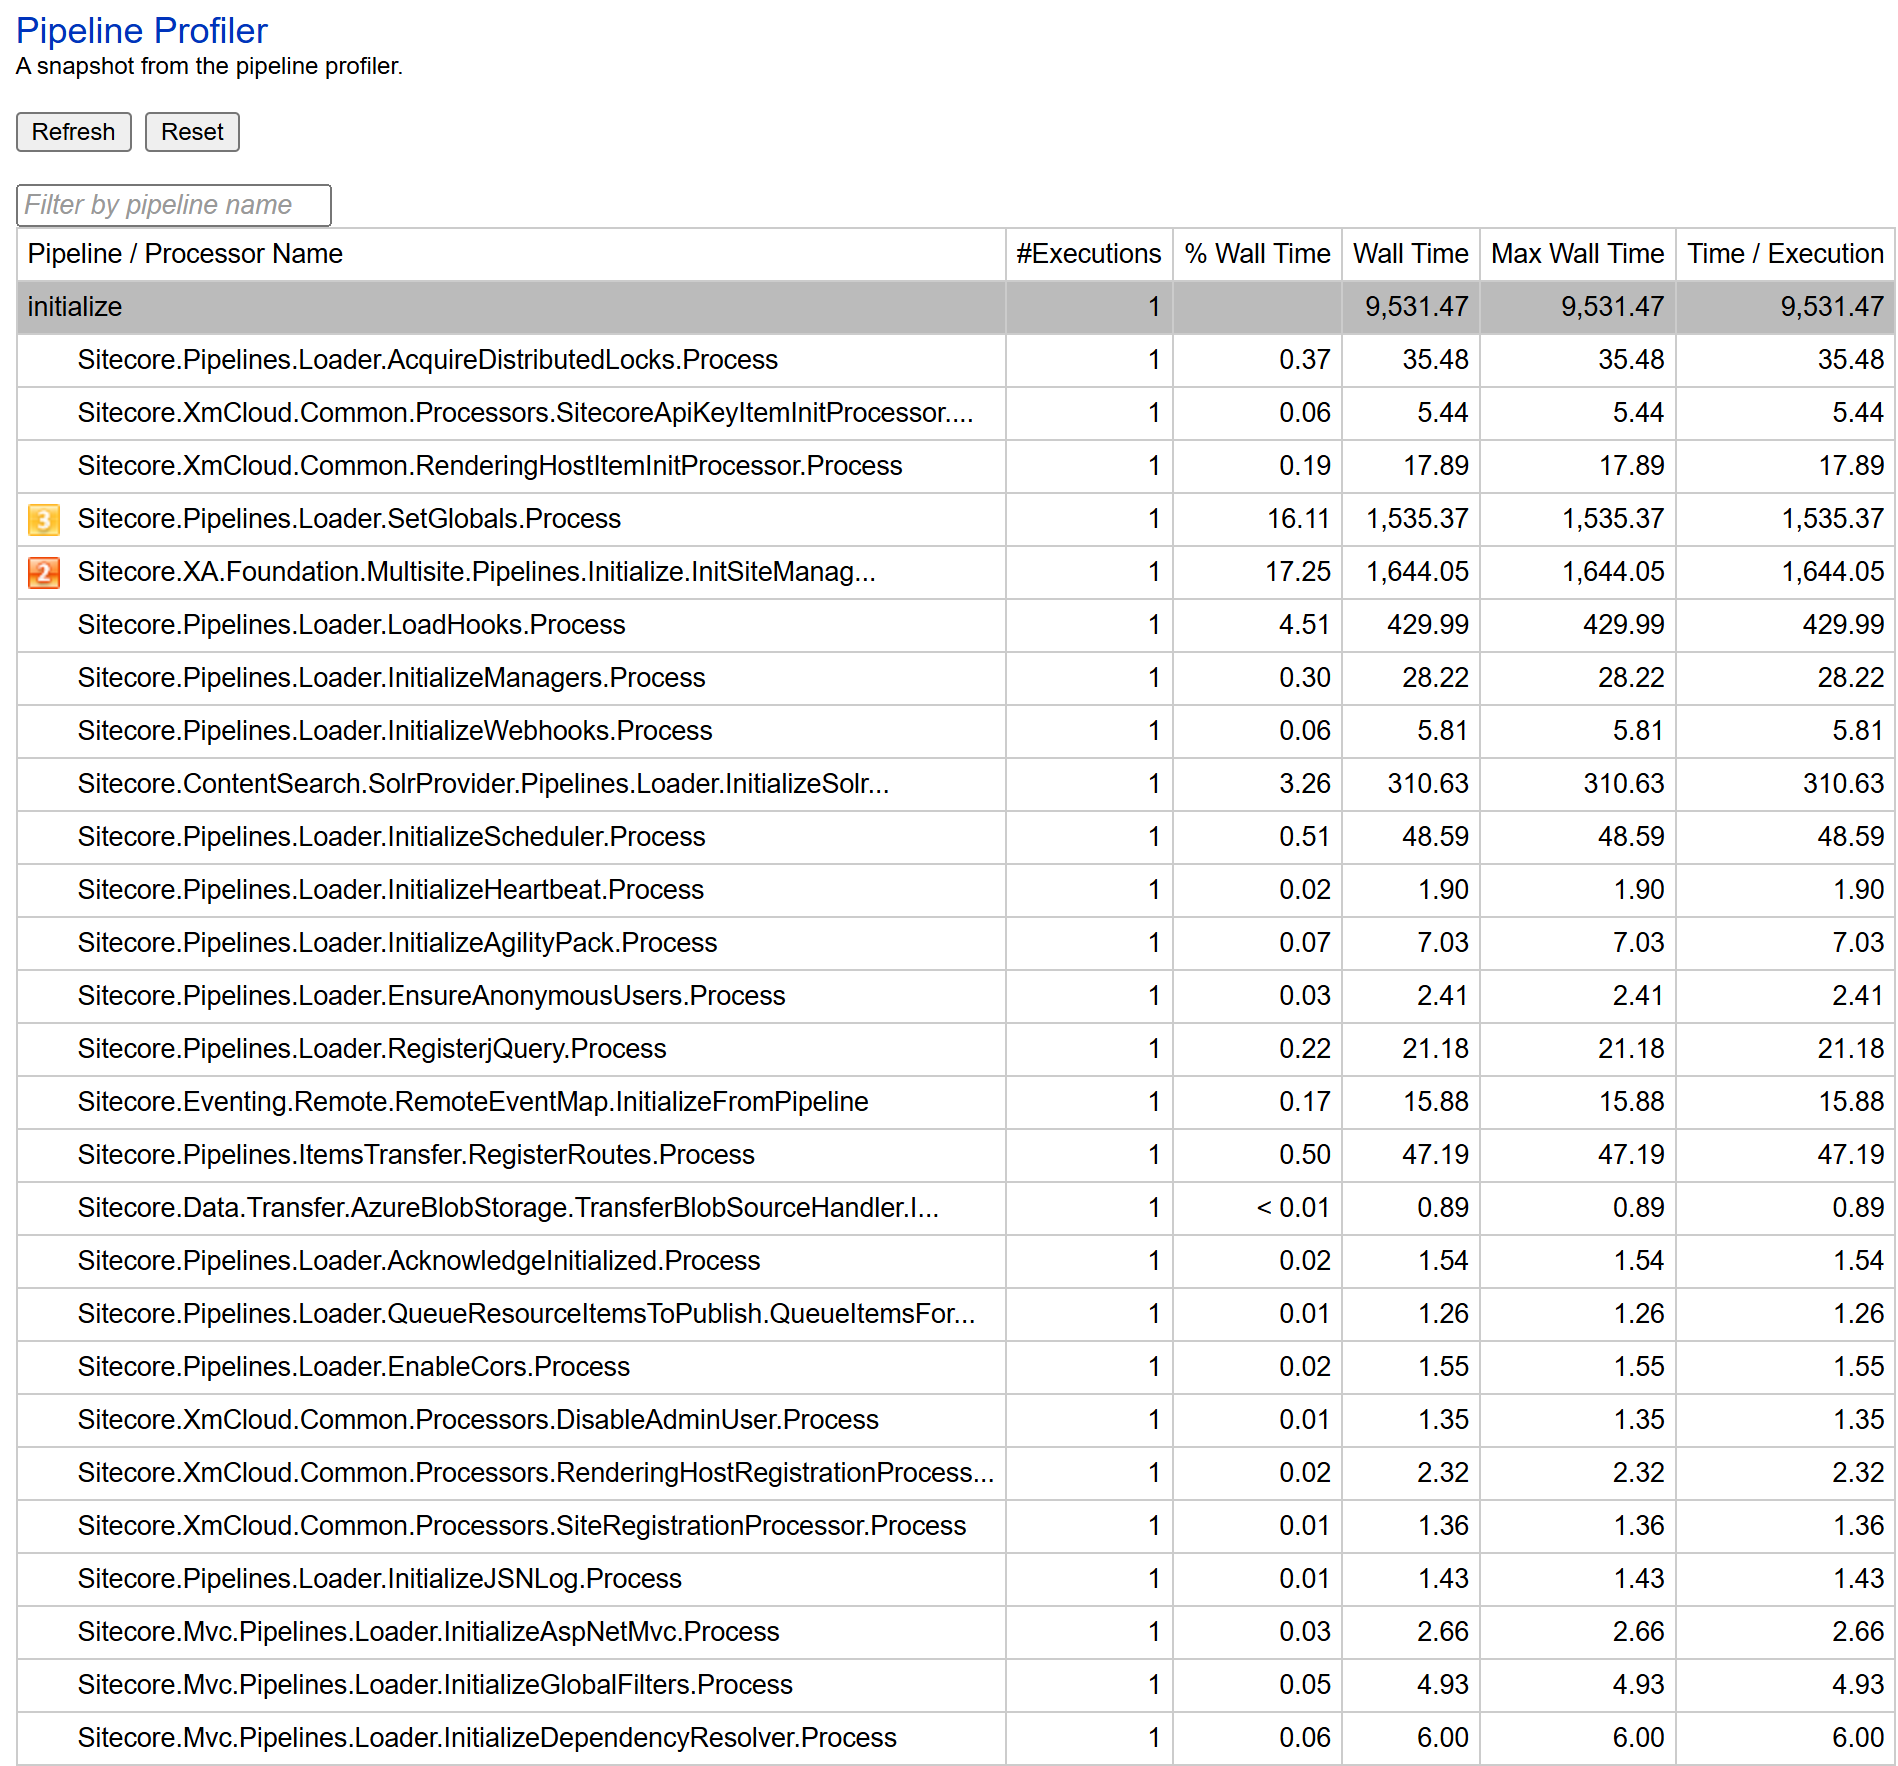
There's a Refresh button on the page; clicking it will update the stats to include any pipelines run since the last refresh. You can filter by pipeline name or simply scroll to see various pipelines, such as initialize, renderLayout, item:saved, publishItem, etc. Each pipeline row can be expanded to show all the processors within it, in the order they execute. The key columns to pay attention to are:
- #Executions: how many times that pipeline or processor has run since the last reset. For example, after a site startup, you might see the
initialize pipeline ran once, whereas something else runs for every HTTP request, so it could be, say, 50 if you've made 50 page requests so far.
-
Wall Time / Time per Execution: the total time spent in that pipeline or processor, and the average time for a single execution. It is particularly useful for spotting slow components; if a single run of a processor takes, say, 500ms on average, that’s a potential performance hot-spot to investigate.
- % Wall Time: the percentage of the pipeline’s total time that a given processor accounted for. This helps identify which processor within a pipeline is the major contributor to the total time. For example, if one processor is 90% of the pipeline’s execution time, that’s your primary suspect.
-
Max Wall Time: the longest single execution time observed for that pipeline or processor. This is useful to identify spikes or inconsistent performance. If the max time is significantly higher than the average, it means one of the executions had an outlier slow run.
Remember to Remove/Undo the Config
If you added a config patch or environment variable for profiling, make sure to remove or disable it after you're done. For example, in XM Cloud SaaS, that means taking it out of your code (and redeploying) or toggling off the environment variable in your cloud portal settings. This prevents someone from accidentally leaving it on. It also ensures your deployments are clean and you don't want to carry a debugging setting to higher environments unknowingly.
Enabling pipeline profiling in XM Cloud is straightforward and gives Sitecore developers a powerful lens to observe the inner workings of the platform. Whether you’re chasing down a production slowdown or ensuring your custom pipelines run as expected, this feature can save you countless hours. As always, use it wisely!